1.2 Variables and variable definitions
The microdata.no analysis system has a wide range of demographic, educational, economic, employment and social security variables in the database. The variables are comprehensively described in the variable overview found on the opening page (https://microdata.no/discovery):
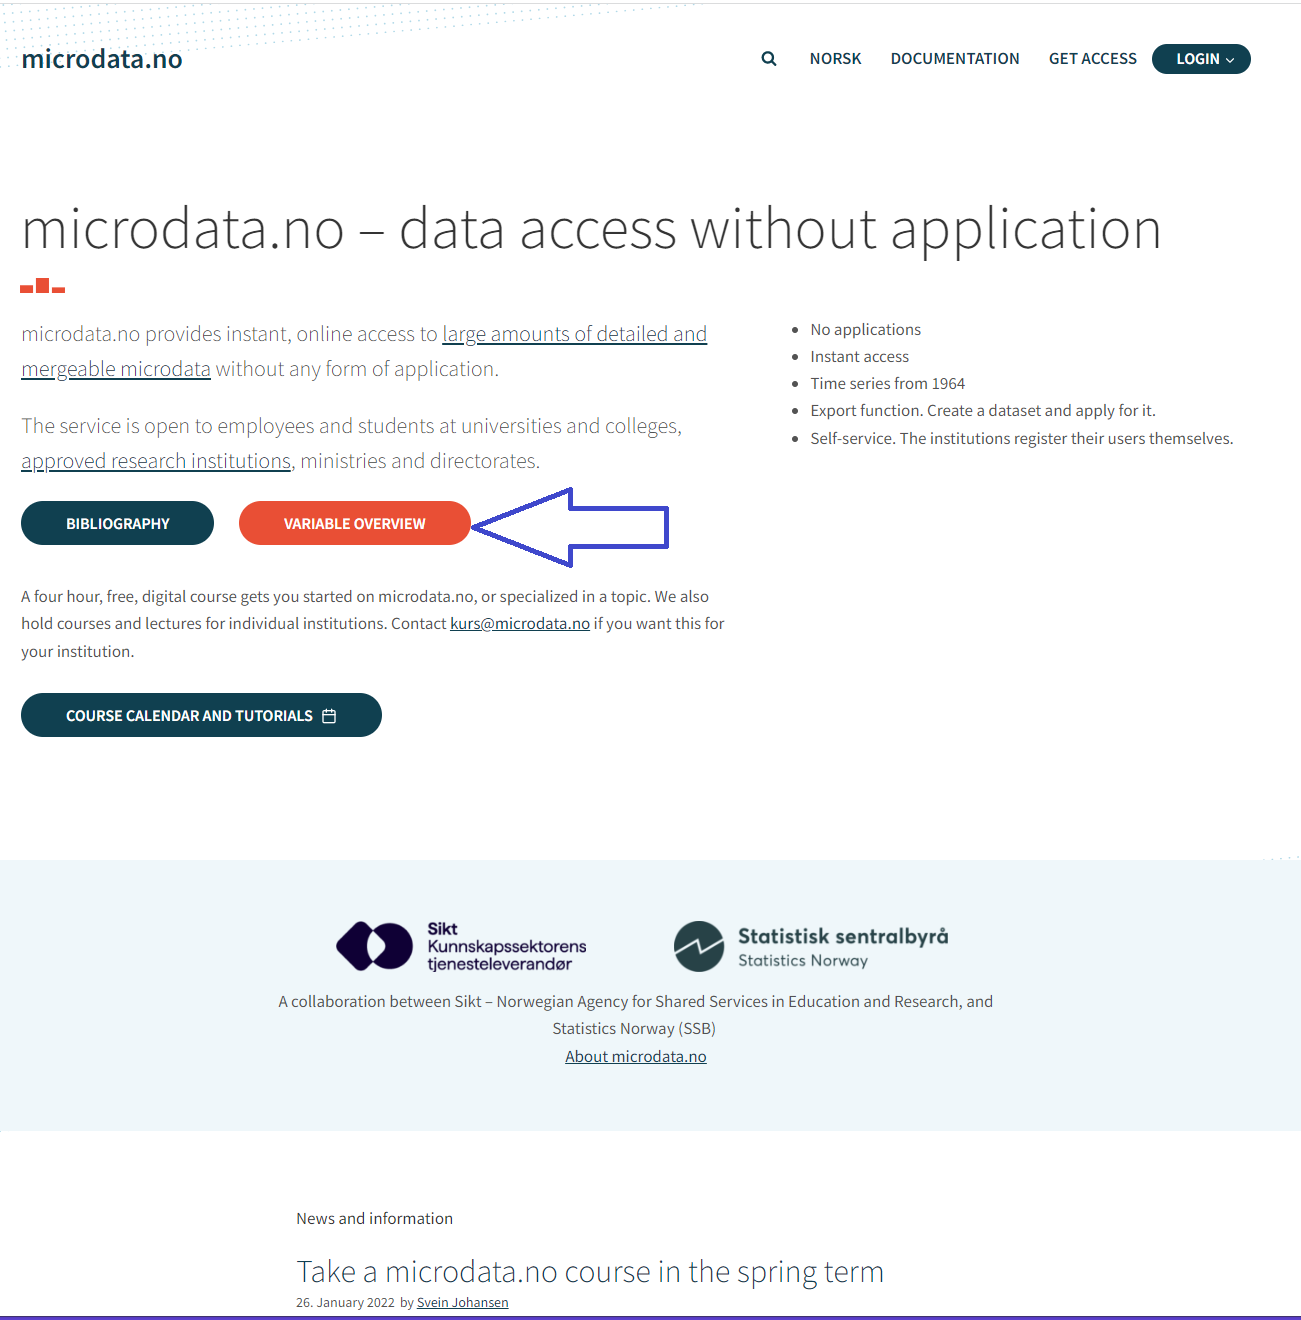
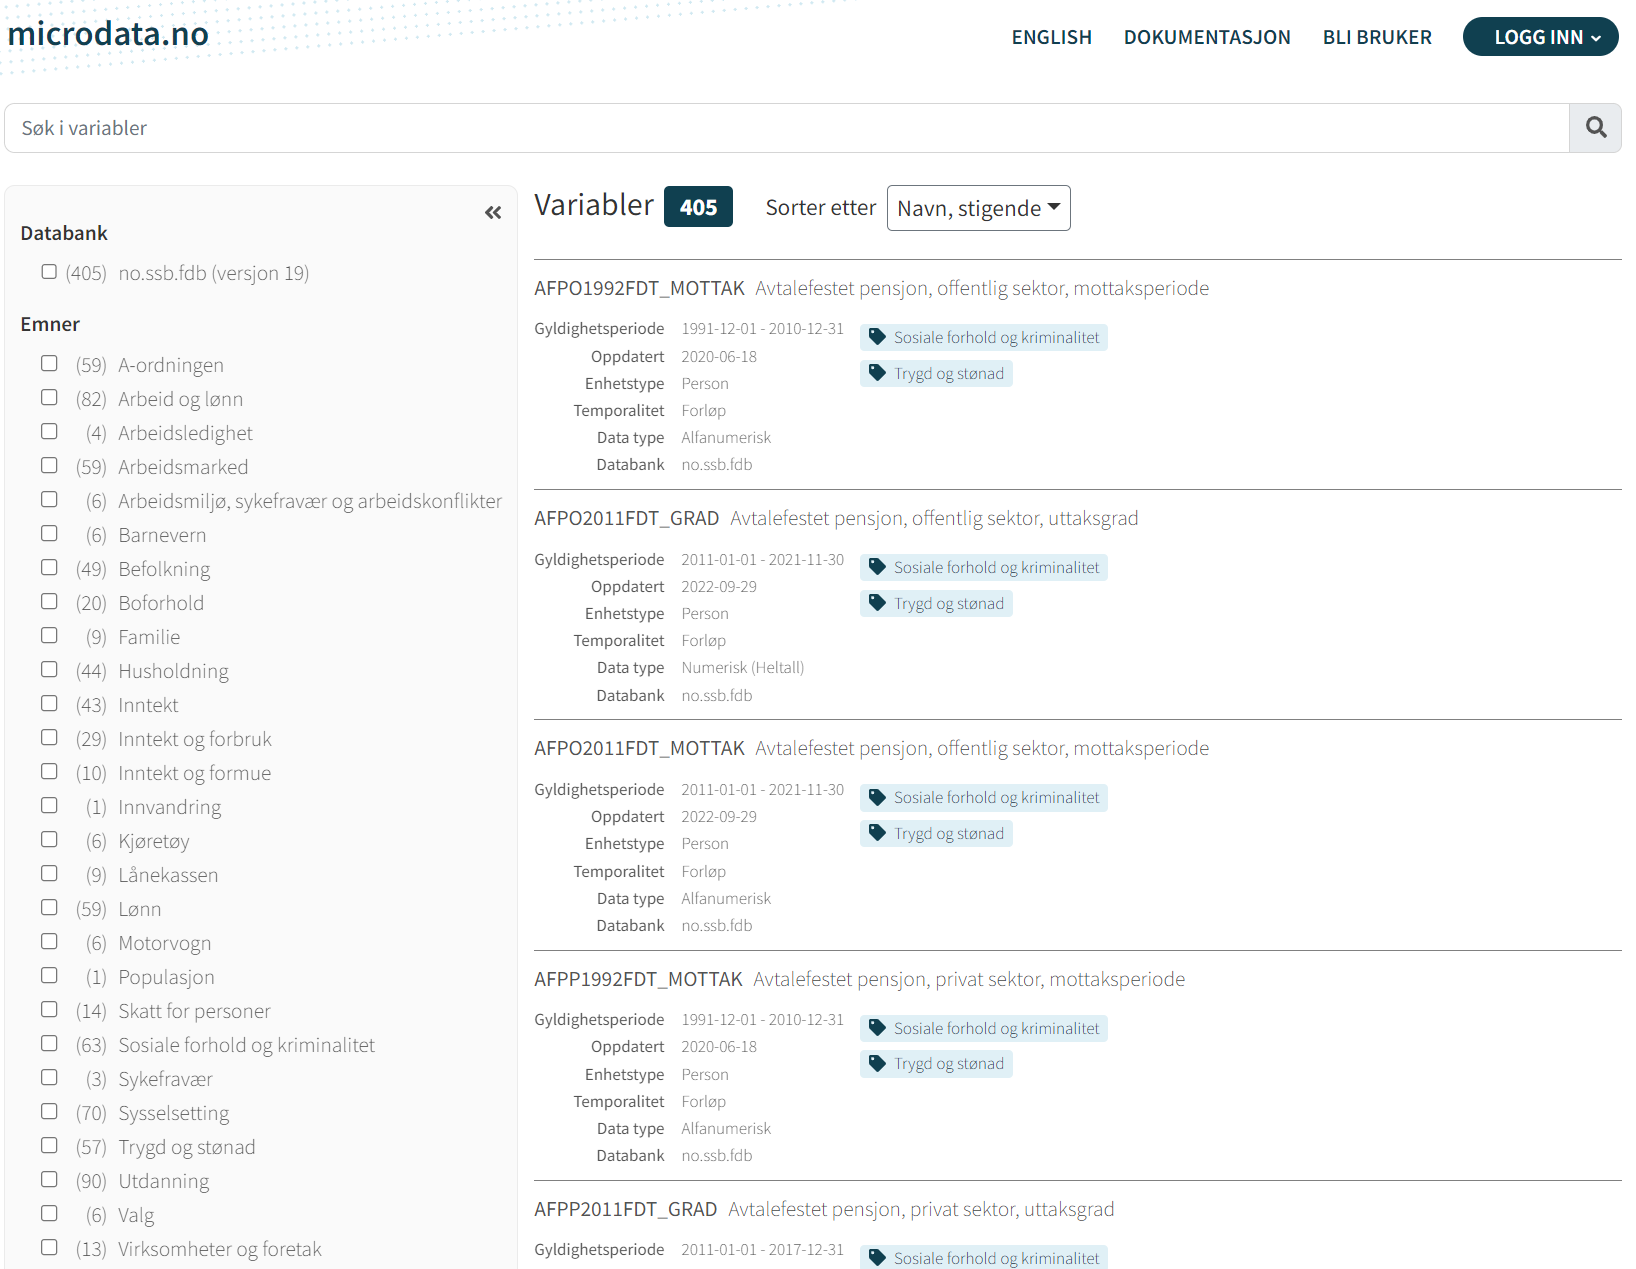
The variable list shows an overview of all variables in the database (437 in Statistics Norway's database per August 2023), and you can use search functionality to more easily find variables you are looking for.
It is also possible to filter searches by selecting the desired database, subject area, data type, unit type, key variable and/or temporality.
By clicking on a variable in the variable list, you get definitions, code lists, change history and other key information related to the specific variable:

Note that variable information is currently only available in Norwegian.
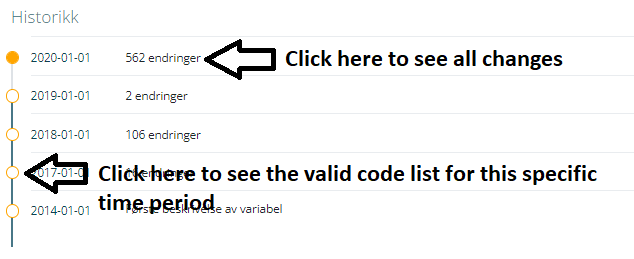
Be aware that the code list for a given variable changes over time. This must be taken into account if you work with longer time series that extend back in time. It is the current code list that applies for the specific time periods. Especially municipal codes, education codes and business codes have relatively frequent changes in the code lists. By clicking on the points in front of the times that indicate the start of a new code version, a current code list for the current time period is displayed. If you click on the indication of changes, you get an overview of which changes have been made for the same time period:
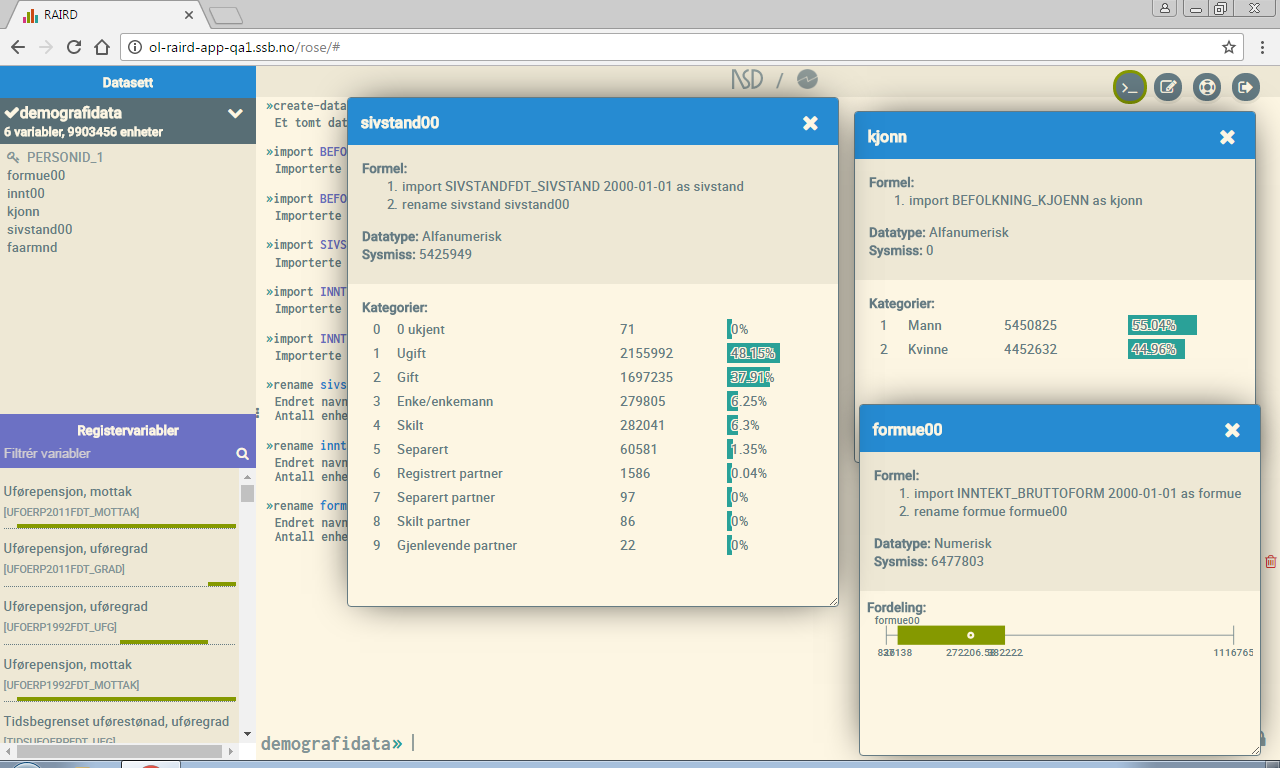
As the illustration below shows, a complete variable overview is also found at the bottom left of the command window. Like the variable list found through the main login site, you may filter the variable list by entering parts of a variable name in the search field, and the filter works both against variable description and the name itself. In this way, it becomes easier to find the variable in question.

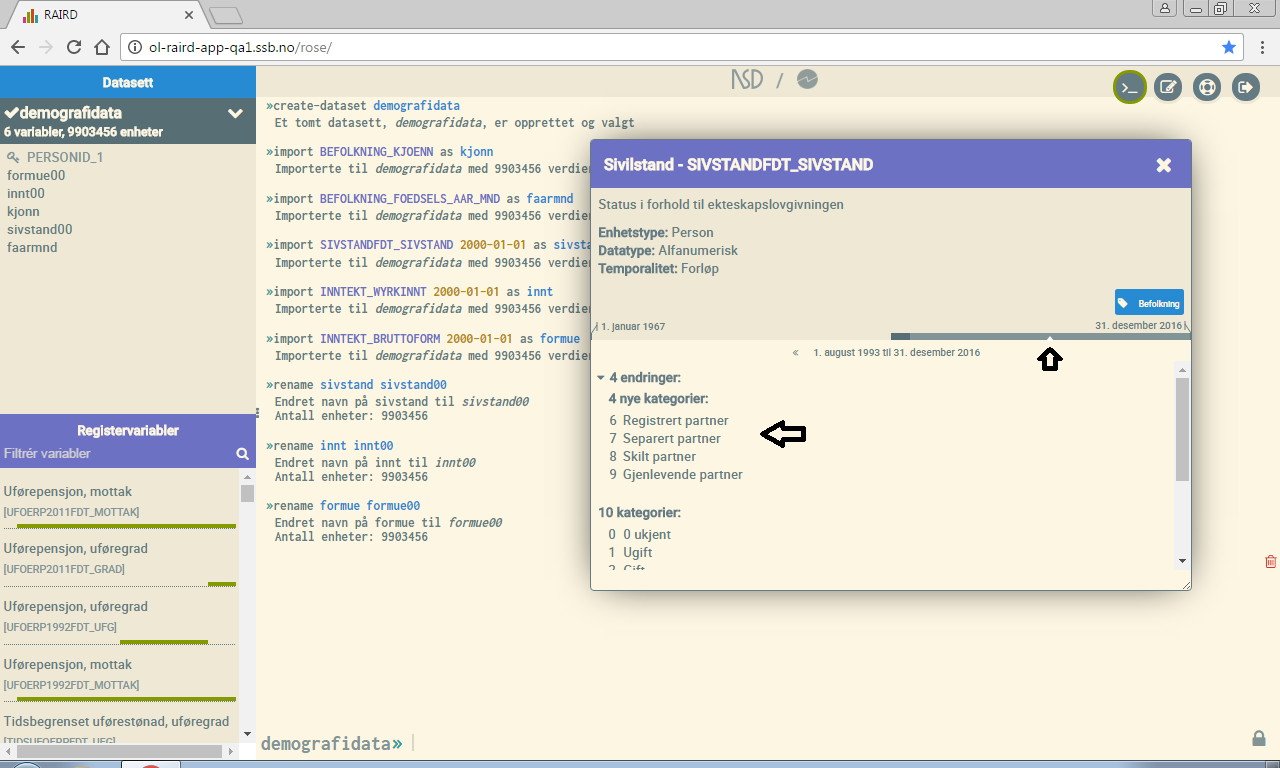
All variables are displayed with an associated timeline that marks the validity period(s), i.e. which time span is covered. Variables in microdata.no are three-dimensional - they contain time. By "clicking" on variables in the list, descriptive statistics and other information such as variable type can be retrieved.
In the example below, this is exemplified for the variable "Sivilstand" ("Marital status"). The variable is presented in a separate movable and resizable window. It provides detailed information about the variable:
-
Key information: Variable name, variable label, variable description, variable type
-
Detailed interactive timeline that allows for studies of changes in coding over time: Changes in the coding are displayed through different colors illustrating the time periods to which they apply. Clicking on the different fields in the timeline will bring up a list of the codes that were valid during the current period. In the example, the field that applies to August 1, 1993 - December 31, 2016 is marked, and a list of 10 categories then appears
-
Information about changes: In the example, "4 endringer" ("4 revisions") is shown. This is the number of revisions compared to the previous time period. By clicking on "4 endringer", a list of the new codes will appear

For variables imported to the user's dataset ("demografidata"), a slightly different type of information appears that may be useful when dealing with many different variables. This information adjusts continuously as changes are made to the variables, and appears in separate pop-ups when clicking on variables in the list of your current dataset:
-
Formula: At the top of the window, a "creation history" is presented. This is a tool for insight on how a variable has been created or re-encoded
-
Key information: Variable type and number of units with value for missing data (sysmiss)
-
Frequency distribution and simple statistics: For categorical variables, frequency distribution is displayed, while for continuous variables, a standard boxplot is displayed with a box representing the two middle quartiles plus average and minimum/maximum value (so-called whiskers). If values become unreadable due to overlap, the pop-up window can be expanded.